
Although scenario planning is not a new concept, the upcoming Metropolitan Planning Organization’s Constrained Long-Range Transportation Plan will use it in an innovative way. As a way of definition, scenario planning is the framework of performing a future risk assessment and benefit analysis to determine potential strengths and weaknesses which affect our region. This assists in current and long-range local/regional planning pursuits.
In 2014, the Steering Committee of the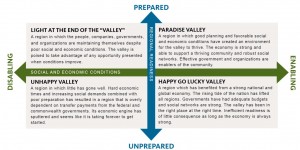
Livable Roanoke Valley Plan developed
four scenarios, which focus on preparedness and ability of the Valley to thrive and prosper. The scenarios were used to determine a future vision for the Roanoke Valley, and became part of the Livable Roanoke Valley Plan.
As the MPO staff begins development of the 2040 Constrained Long-Range Transportation Plan, we will be utilizing the four Livable Roanoke Valley scenarios: Paradise Valley, Light at the End of the Valley, Happy-Go Lucky Valley and Unhappy Valley. The four scenarios will play a critical role in making population and employment projections within Traffic Analysis Zones (TAZs)–areas developed locally for calculating traffic related data. Using 2040 population and employment estimates compiled for each of the 204 TAZs in the Roanoke Urbanized Area, staff has developed corresponding projections based on each future scenario. These projections will lead to more precise analysis and policy recommendations, based on future outcomes; and staff will utilize the scenarios to plan with an eye towards preventing the worst possible regional future.
In addition to using scenario planning to anticipate population and employment changes in the TAZs, MPO staff utilize GIS software maker ESRI’s Tapestry Segmentation to incorporate an additional data layer. Simply stated, Tapestry Segmentation is a method of surveying and analyzing large populations in order to quantify diversity, trends, lifestyles and life stages. It takes into account population, household, migration, housing, economic, educational and income characteristics and produces a “fabric” of a particular geography. By utilizing this approach, it is like what people in marketing use as a marketing framework strategy.
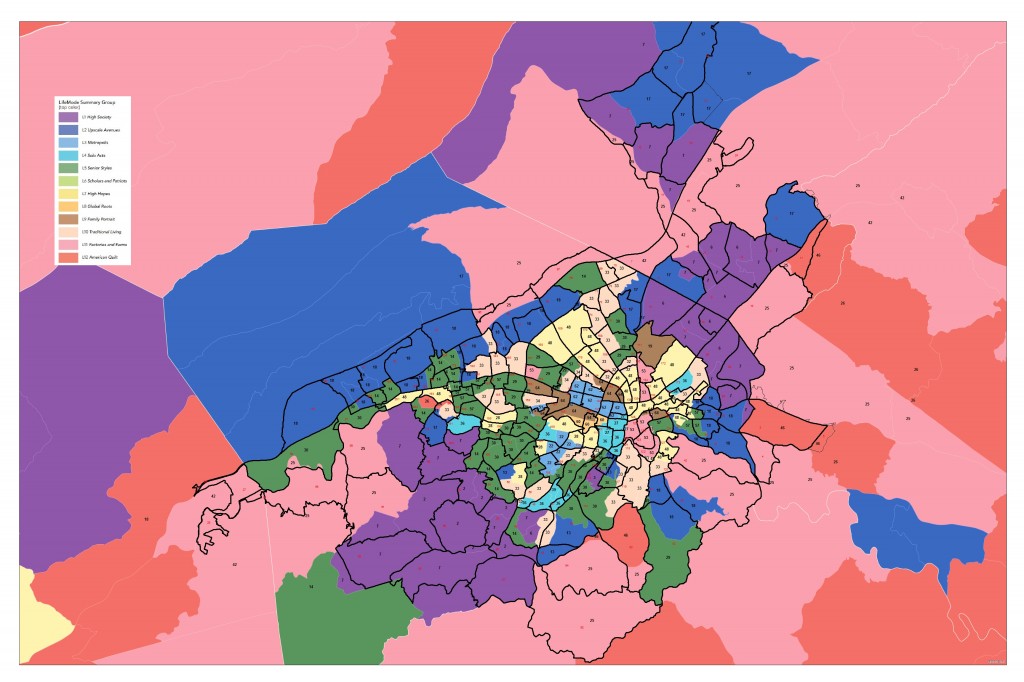 Based on the data collected for each geography, ESRI has 12 uniquely designated Lifemode Summary Groups, which take into account lifestyles and various stages of life (e.g. Upscale Avenues and American Quilt). Within these Lifemode Groups are 65 segments, which reveal more specific characteristics.
In the months to come, as MPO staff analyzes future trends by projecting population and employment based on both the four scenarios and the Tapestry Segmentation Lifemode Groups, we hope to discover additional dynamics to allow us develop better transportation policies and recommendations.
[google-translator]